Company Spotlight: Target Corporation (TGT)
Target's revenue rose 7.1% from a year earlier, and management raised its full-year outlook again.
By Faircurve Research
One company, read closely · Public edition · on the close of Thu 19 Nov
Target raises its full-year sales outlook to around 6%, but leaves FY2027 earnings unguided
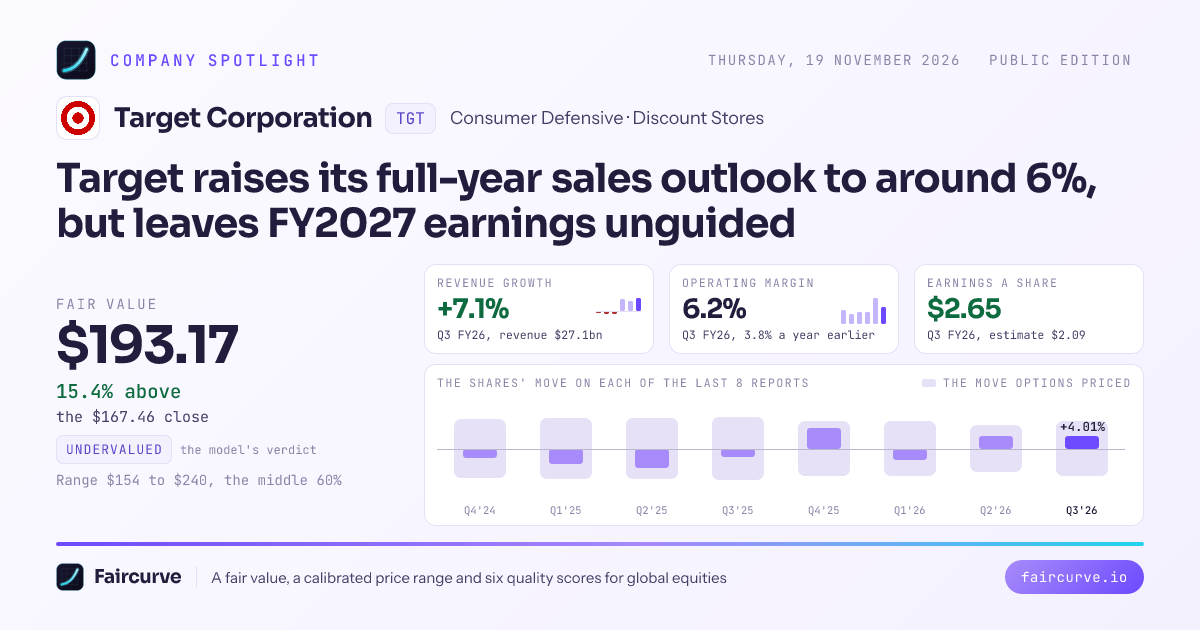
Target's revenue rose 7.1% from a year earlier, and management raised its full-year outlook again. The open risk is FY2027 earnings, since tariff refunds that will not repeat lift this year's margin. The price already assumes free cash flow of about 52% of what Target produced over the last four quarters.
The close sits inside the model's range, above 30% of its outcomes
The model's fair values for Target from its run of 14 November 2026, before the results. The shaded band is the middle 60%, the model's range of $154 to $240.
Source: Faircurve's model
Target Corporation (TGT) shares rose 4.01% on 18 November 2026, the day it reported Q3 FY2026 before the open, against a move of 9.1% either way that the options had priced. The shares had moved by more than the options priced after none of the last eight reports, and they closed at $159.53 on the eve of the report.
Target's shares moved less than the options had priced after 8 of the last 8 reports, and the latest move was 4.01%
The shares' move on each report's own window, against the move the options priced before it.
Source: Faircurve's price archive and its options collection
The worry going into the report was whether the sales rebound would last. Michael J. Fiddelke, the ceo, said on the call of Q3 FY2026 that traffic is rising in five of six key categories. The quarter bore him out, with comparable sales up 5.6% on a 5% increase in traffic, after a 2.7% fall in Q3 FY2025.
Target beat consensus on revenue and earnings, and tariff refunds supplied part of the earnings beat. Revenue of $27.1 billion beat the $26.5 billion estimate, and earnings of $2.65 a share beat the estimate of $2.09 a share, the sixth beat in a row. Management said tariff refunds were worth about $0.50 a share in the quarter. Without them, earnings come to $2.15 a share, still above the $2.09 estimate, so the refunds widened a beat that held without them.
Every earnings line grew faster than revenue
Q3 FY2026 against Q3 FY2025, and against the consensus estimate where one is on file.
| The quarter | Q3 FY2026 | Q3 FY2025 | Change | Consensus | Surprise |
|---|---|---|---|---|---|
| Revenue | $27.1bn | $25.3bn | +7% | $26.5bn | +2.0% |
| Operating income | $1.67bn | $948m | +76% | ||
| Earnings a share | $2.65 | $1.78 | +49% | $2.09 | +26.8% |
| Free cash flow | -$150m | $149m | -201% |
Source: the company’s statements and earnings calls, analysts’ consensus
Management raised its full-year guidance again on the call of Q3 FY2026. James Lee, the chief financial officer, now expects net sales growth of around 6% and earnings of between $10.65 a share and $11.40 a share, both raised from the call of Q2 FY2026. The earnings range brackets the consensus estimate of $10.87 a share. Lee also guides an operating margin of around 6.2%, including about 110 basis points of benefit from tariff refunds. He gave no earnings guidance for FY2027. Part of this year's raise therefore rests on refunds that FY2027 earnings lose.
The year's non-GAAP EPS guide was raised on 3 of 7 calls
What management guided for the year's EPS, call by call, at the middle of each range. FY2025 is still open.
Source: the company's earnings calls and statements, read by Faircurve
Management is putting the cash into stores, staff and the supply chain, and conceded that apparel still lags. Fiddelke said on the call of Q3 FY2026 that new stores in communities without one lift share sharply and earn strong returns. Lee tied higher selling, general and administrative costs mainly to planned spending on store hours, training and new stores. Cara Sylvester said women's fashion had become too complex, and that Target is cutting style counts by about 20% and lowering prices on hundreds of items. Capital spending of about $3.8 billion in the first nine months of FY2026, against $342 million of buybacks over the last four quarters, puts stores first in the use of cash.
The base for FY2027 earnings is unclear, because refunds lift this year's results and management has not said what replaces them. Target received about $300 million of tariff refunds in Q3 FY2026, worth about $0.50 a share, management said. Lee guided an operating margin excluding refunds of 5.1% on the call of Q2 FY2026, which is what the 6.2% guide leaves once refunds are removed. That compares with the 4.6% adjusted rate of FY2025, and Lee called the rate without refunds the better measure. Asked on the same call what the 2027 earnings base is, management gave no number. Lee's own preferred rate is therefore the margin FY2027 starts from.
Target is spending more on stores than the quarter's cash covered, and plans to spend more next year. Free cash flow was -$150 million in Q3 FY2026 as capital spending rose. Lee expects capital spending of between $5.00 billion and $6.00 billion in FY2027, a step up from this year's plan. Today's price already assumes free cash flow of $2.17 billion a year. The FY2027 step-up therefore starts from a quarter whose free cash flow was already negative, so holiday-quarter cash is the figure to watch.
Today's price needs $2.17 billion of free cash flow a year, about 0.5 times what Target reported
Reported free cash flow over the last four quarters and the free cash flow today's price needs.
Source: the company's statements as filed, Faircurve's arithmetic
Target entered the holiday with stock growing faster than in recent quarters. Inventory ended Q3 FY2026 at $16.1 billion, up about 8% from a year earlier, after a rise of about 3% in Q2 FY2026. When inventory ran up 11% in Q1 FY2025, markdowns followed in Q2 FY2025. Management says it would rather chase inventory against strong sales than cancel orders or mark down excess stock. It states that preference, yet it built stock slightly ahead of sales going into the holiday.
Faircurve's two valuations agree on direction and differ on size. The model's fair value is $193.17 a share, 15.4% above the close of $167.46 on 19 November 2026, from its run of 14 November 2026, before these results. At that run the model's verdict was Undervalued, with a high evidence grade. The cash flow value is $242.03 a share, 44.5% above the close. The model compares Target with similar companies on earnings before capital spending, while the cash flow value counts only the profit left after the reinvestment its growth requires. The close sits below both values, closer to the model's fair value than to the cash flow value.
The close sits below both of Faircurve's values
Faircurve's two values a share against the close of 19 November 2026, drawn to scale.
Source: the company's statements as filed and Faircurve's model
The case against, the case for
The case against rests on caution in management's words and in insiders' trades. Hedging words rose to 12.9 per thousand on the call of Q3 FY2026, against an average of 10.2 on the previous seven calls, on the same call that raised every outlook. Insiders sold $26 million of shares over the past year and bought none, and $21 million of the sales were by Brian C. Cornell, the executive chair of the board. Asked what comparable sales growth FY2027 needs to cover rising selling, general and administrative costs, management gave no figure. Its first sales guide for FY2025 called for 1% growth, and sales fell 1.7%, so the unstated FY2027 base rests on guidance that has missed before.
The case for rests on returns and the balance sheet. Target earned 15.9% on its capital over the last four quarters, 10.5 points above its 5.4% cost of capital. It trades at 9.12 times EBITDA, 23% below the 11.9 times that its margins, growth and use of assets go with. Analysts' consensus target is $168.86, with one rating raised and none cut in the past 90 days. None of Faircurve's five solvency tests raises a warning, and a new $4.00 billion revolving credit facility runs to August 2031, so the balance sheet can carry the larger spending plan.
The tables
The last eight quarters| Quarter | Revenue | Operating income | Net income | Operating cash flow | Capital spending | Free cash flow | EPS |
|---|---|---|---|---|---|---|---|
| Q4 FY2024 | $30.9 billion | $1.47 billion | $1.10 billion | $3.29 billion | $923 million | $2.37 billion | $2.41 |
| Q1 FY2025 | $23.8 billion | $1.47 billion | $1.04 billion | $275 million | $790 million | -$515 million | $2.27 |
| Q2 FY2025 | $25.2 billion | $1.32 billion | $935 million | $2.08 billion | $1.07 billion | $1.01 billion | $2.05 |
| Q3 FY2025 | $25.3 billion | $948 million | $689 million | $1.13 billion | $978 million | $149 million | $1.51 |
| Q4 FY2025 | $30.5 billion | $1.38 billion | $1.04 billion | $3.08 billion | $885 million | $2.19 billion | $2.30 |
| Q1 FY2026 | $25.4 billion | $1.14 billion | $781 million | $716 million | $1.03 billion | -$319 million | $1.71 |
| Q2 FY2026 | $26.5 billion | $2.56 billion | $1.88 billion | $3.80 billion | $1.37 billion | $2.43 billion | $4.11 |
| Q3 FY2026 | $27.1 billion | $1.67 billion | $1.21 billion | $1.21 billion | $1.36 billion | -$150 million | $2.65 |
| Company | Market value | Forward P/E | EV / EBITDA | EBITDA margin | Revenue growth | Quality |
|---|---|---|---|---|---|---|
| TGT | $76.6bn | 16.7 | 10.9 | 8.0% | -1.7% | 54 |
| WMT | $1.00tn | 39.9 | 22.8 | 6.5% | 4.7% | 55 |
| COST | $485bn | 46.9 | 33.1 | 4.7% | 10.1% | 83 |
| KR | $40.1bn | 12.5 | 10.7 | 3.9% | 0.4% | 41 |
| DG | $29.5bn | 16.1 | 13.6 | 7.6% | 5.2% | 48 |
| DLTR | $26.3bn | 17.8 | 13.8 | 12.2% | 10.4% | 61 |
| BJ | $14.0bn | 22.1 | 15.0 | 5.1% | 4.7% | 49 |
Solvency, no warning. Equity is 28.7 cents of every dollar of assets, a modest cushion ($18.4 billion of equity on $64.0 billion of assets, liabilities of $45.7 billion). Interest took 0.4% of revenue over the last four quarters ($408 million on $110 billion), a light burden. Operating income covered interest 16.5 times over the last four quarters ($6.75 billion against $408 million), a comfortable cover. Debt is $18.7 billion (of which $3.34 billion is leases) against $4.46 billion of cash, net debt $14.2 billion, 1.4 times the last four quarters' EBITDA, a low load. The company paid about 2.1% on its debt and earned 15.9% on its capital over the last four quarters.
Depreciation and cash, no warning. In the last fiscal year depreciation grew 5% while revenue grew -2%. Capital spending ran at 1.4 times depreciation over the last four quarters ($4.65 billion against $3.21 billion). Capital spending was 4% of revenue over the last four quarters. Free cash flow was 0.85 of net income over the last four quarters ($4.16 billion against $4.91 billion). The annual report states a useful life of 8 - 39 years for buildings and improvements. The annual report states a useful life of 2 - 15 years for fixtures and equipment. The annual report states a useful life of 2 - 7 years for computer hardware and software.
Governance, one note. In the past twelve months 5 insiders filed 8 sales reports covering $26 million of shares, and bought on the open market 0 times; the largest sellers were Cornell Brian C (executive officer) $21 million, Kremer Melissa K (executive officer) $2.6 million, SYLVESTER CARA A (executive officer) $1.3 million. Stock-based pay was 0.3% of revenue over the last four quarters ($328 million), a light share. The diluted share count fell 1.3% over the last fiscal year; $342 million of shares were bought back over the last four quarters.
Purchase obligations including merchandise royalties, equipment purchases, marketing contracts, software commitments, firm inventory minimums and service contracts, primarily due within three years. Real estate obligations including minimum lease payments for signed leases not yet commenced and real estate purchase, construction or remodel commitments, primarily due within one year. Trade letters of credit outstanding, a portion reflected in Accounts Payable. Standby letters of credit and surety bonds, primarily for insurance and regulatory requirements. Debt maturities: 2026 $2.00 billion, 2027 $97 million, 2028 $581 million, 2029 $1.00 billion, 2030 $1.23 billion, thereafter $9.59 billion. Sources of liquidity (operating cash flows, credit facility capacity, capital market access) are described as adequate for contractual obligations, capex, debt maturities, dividends and buybacks for the foreseeable future. $5.5 billion cash and equivalents at year end.
From the quarterly report for the quarter to 1 August 2026, filed 28 August 2026. These are the later word where they differ from the annual report. Committed $4.0 billion unsecured revolving credit facility obtained in August 2026, expiring August 2031, replacing $1.0 billion and $3.0 billion facilities. Cash and cash equivalents of $5.4 billion as of August 1, 2026. Sources of liquidity (operating cash flows, credit facility capacity, capital market access) are described as adequate for contractual obligations, debt maturities and dividends.
Brian C. Cornell, executive chair of the board. James Lee, chief financial officer. Michael J. Fiddelke, ceo. Lisa Roath, chief operating officer. Cara Sylvester, on the calls. Richard Gomez, on the calls. 8 calls read, from Q4 FY2024 to Q3 FY2026.
Sources: the company's filings and calls, Faircurve's model (run of 14 November 2026), Faircurve's price archive, Faircurve's options collection (from 15 November 2023) and the readings library for the sector.